The UK FY2012 budget:
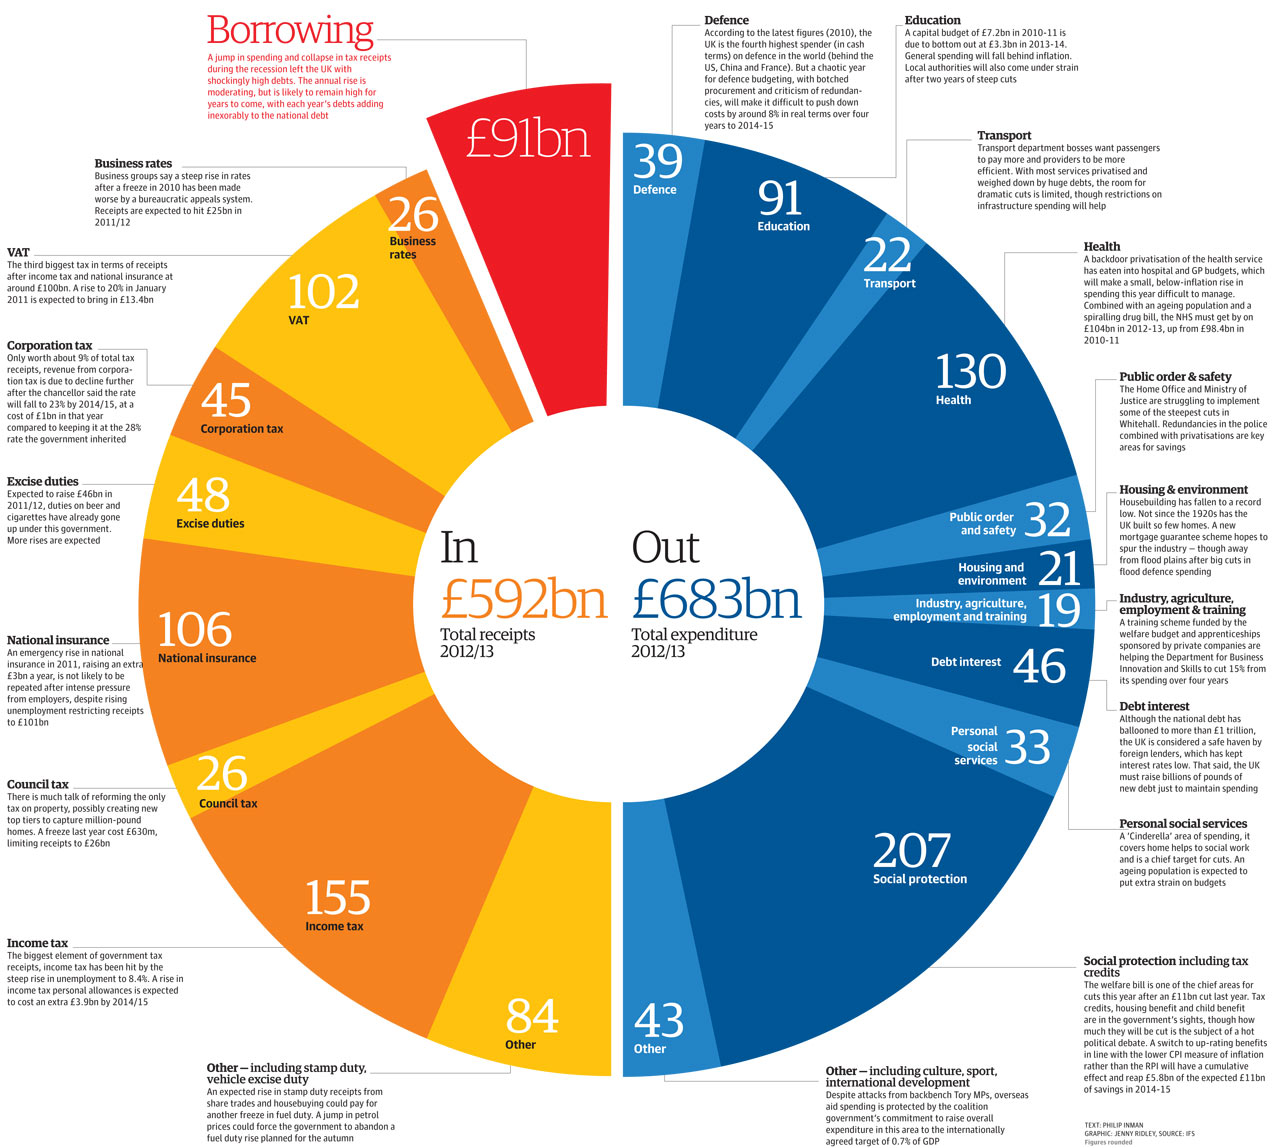
Outlays:
Personal social services: £33 billion
Social protection: £207 billion
Housing and environment: £21 billion
Health: £130 billion
Education: £91 billion
Transportation: £22 billion
Public order and safety: £32 billion
Defence: £39 billion (Good luck defending the Falklands!)
Debt interest: £46 billion
Other: £43 billion
Revenues:
Business rates: £26 billion
VAT: £102 billion
Corporate tax: £45 billion
Excise duties: £48 billion
National Insurance: £106 billion
Council tax: £26 billion
Income tax: £155 billion
Other, including stamp duty and auto excise duty: £84 billion
Borrowing: £91 billion
38.21% of outlays, not including healthcare, is on so-called "safety-net programmes." With healthcare, the sum rises to 57.25%.
44.09% of revenues, not including healthcare, is spent on so-called "safety-net programmes." With healthcare, the sum rises to 66.05%.
No comments:
Post a Comment